Integrated Reporting

The reporting dashboard serves as air traffic control for all the activities going through the platform.
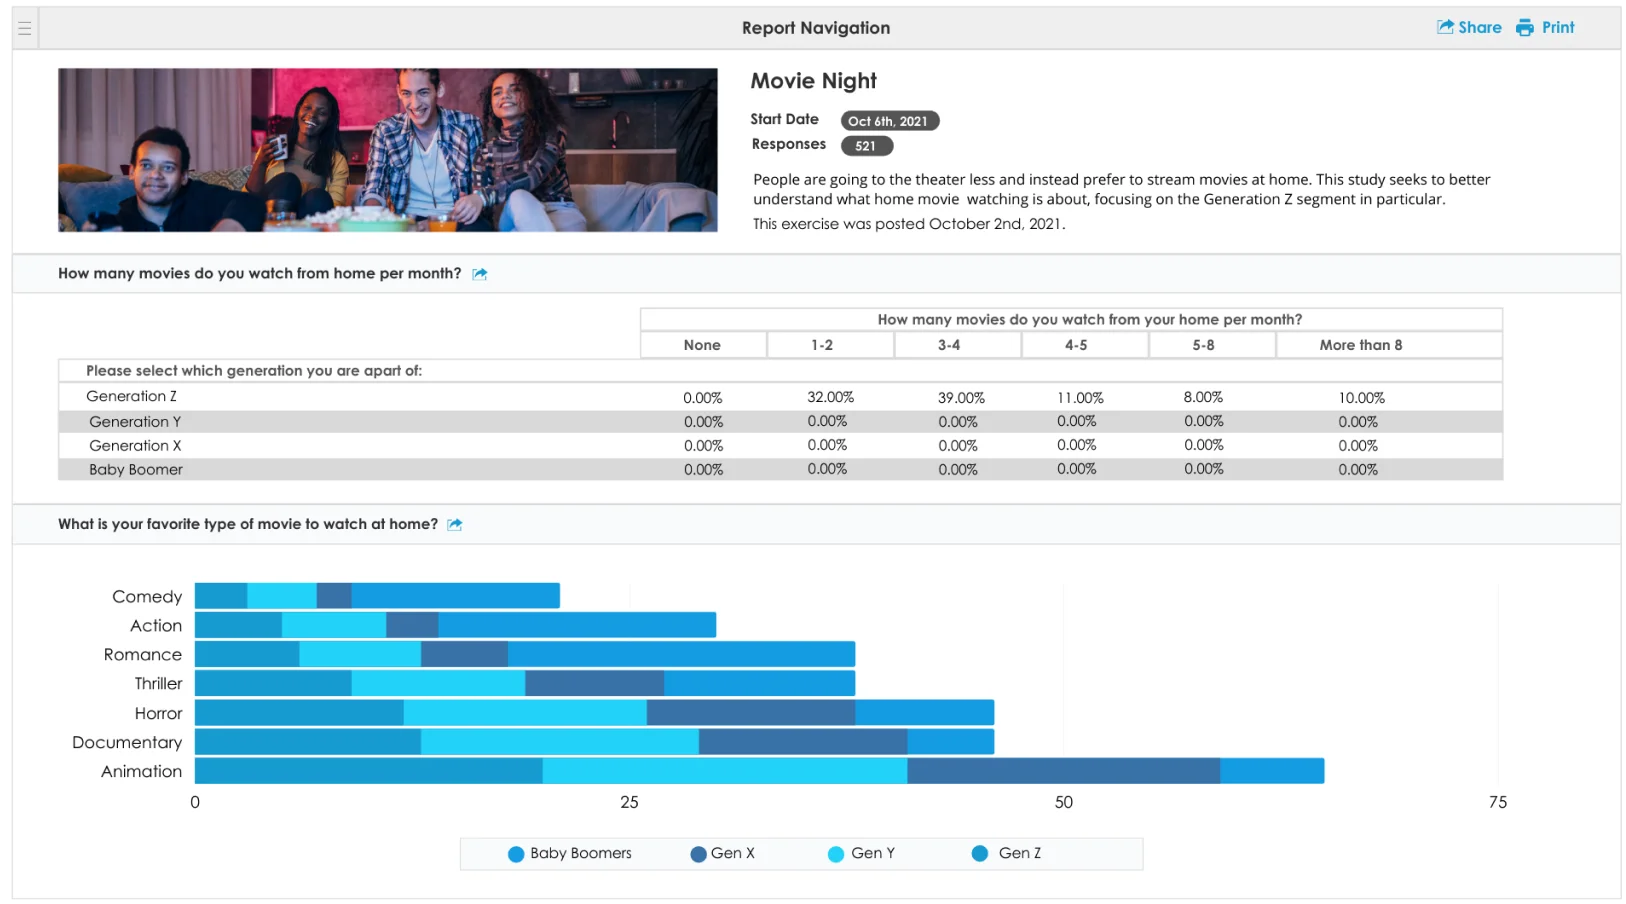
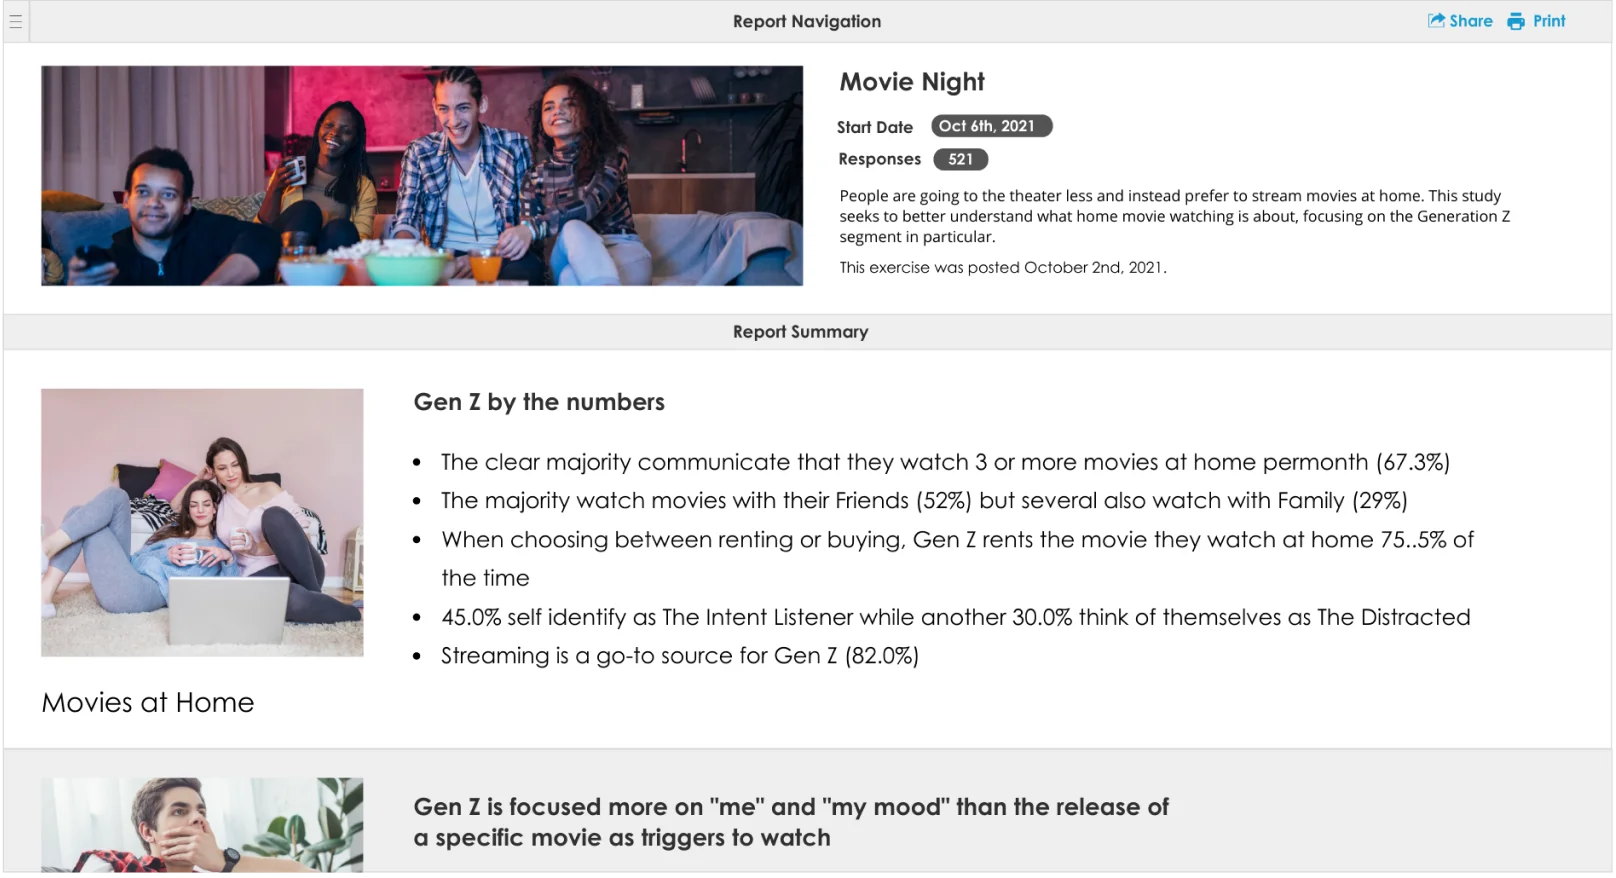
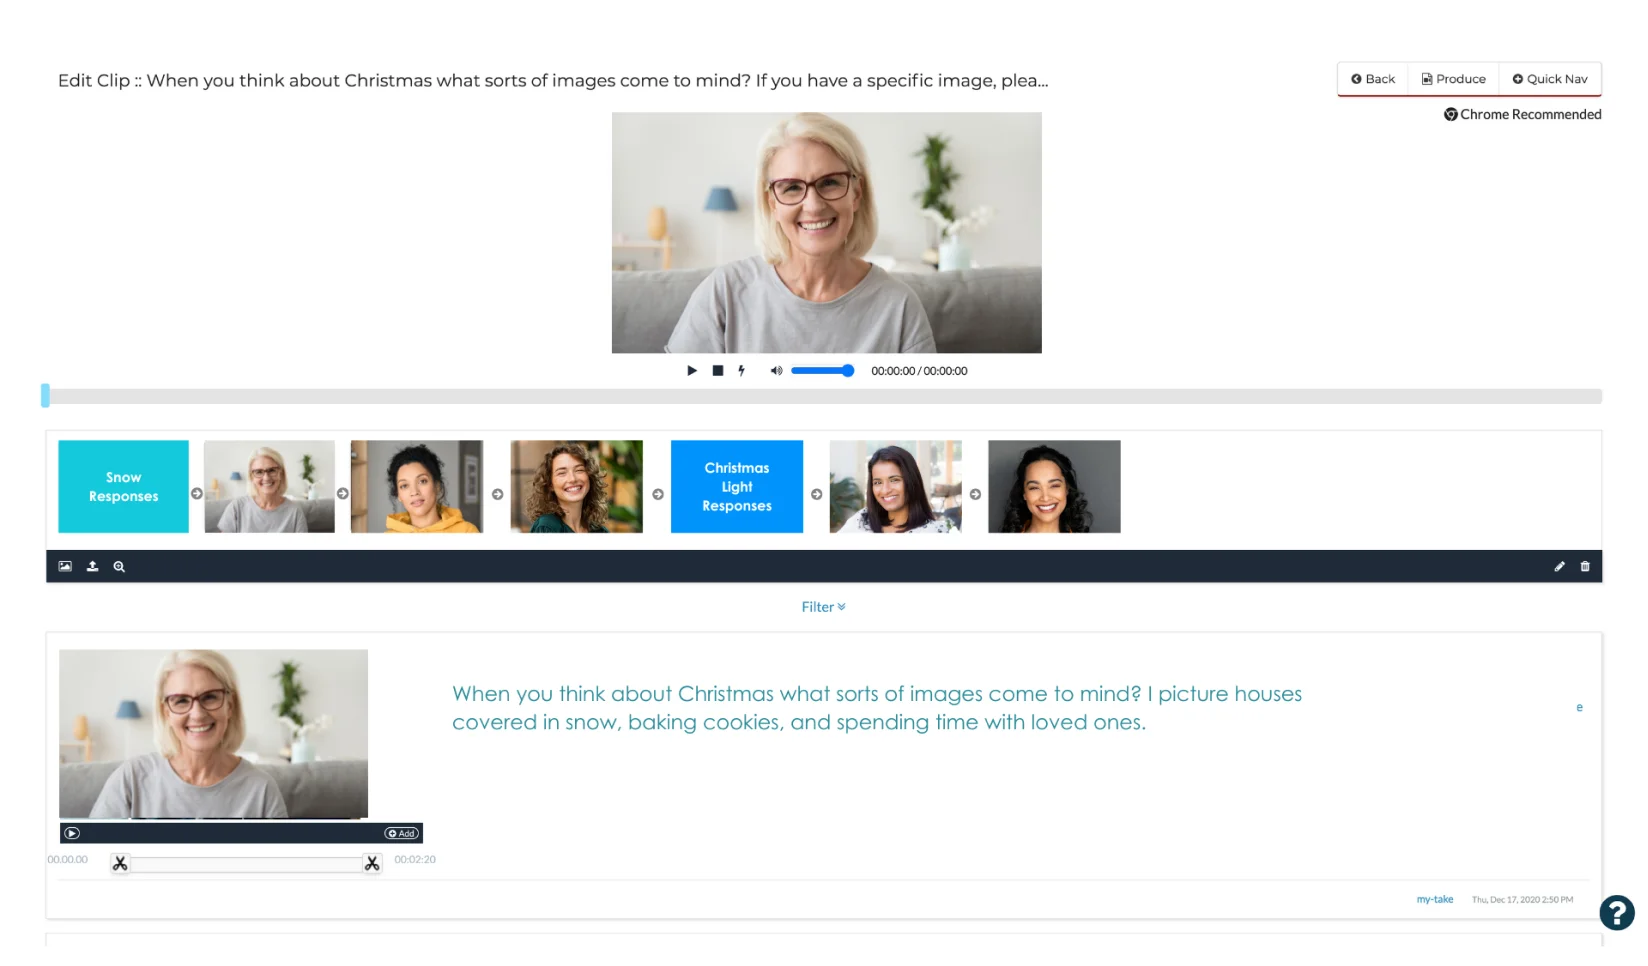
live report

Live Reporting

Live reporting is an incredibly powerful feature of the platform. It allows stakeholders to view results as they happen, and can also be used as a means to see a quick overview of the results and conduct additional analysis.

Data Exports

Export your reports or raw data in a variety of formats including PDF, Excel, and PowerPoint.

exporting data
exporting data

Data Exports

Export your reports or raw data in a variety of formats including PDF, Excel, and PowerPoint.

integrated chart builder

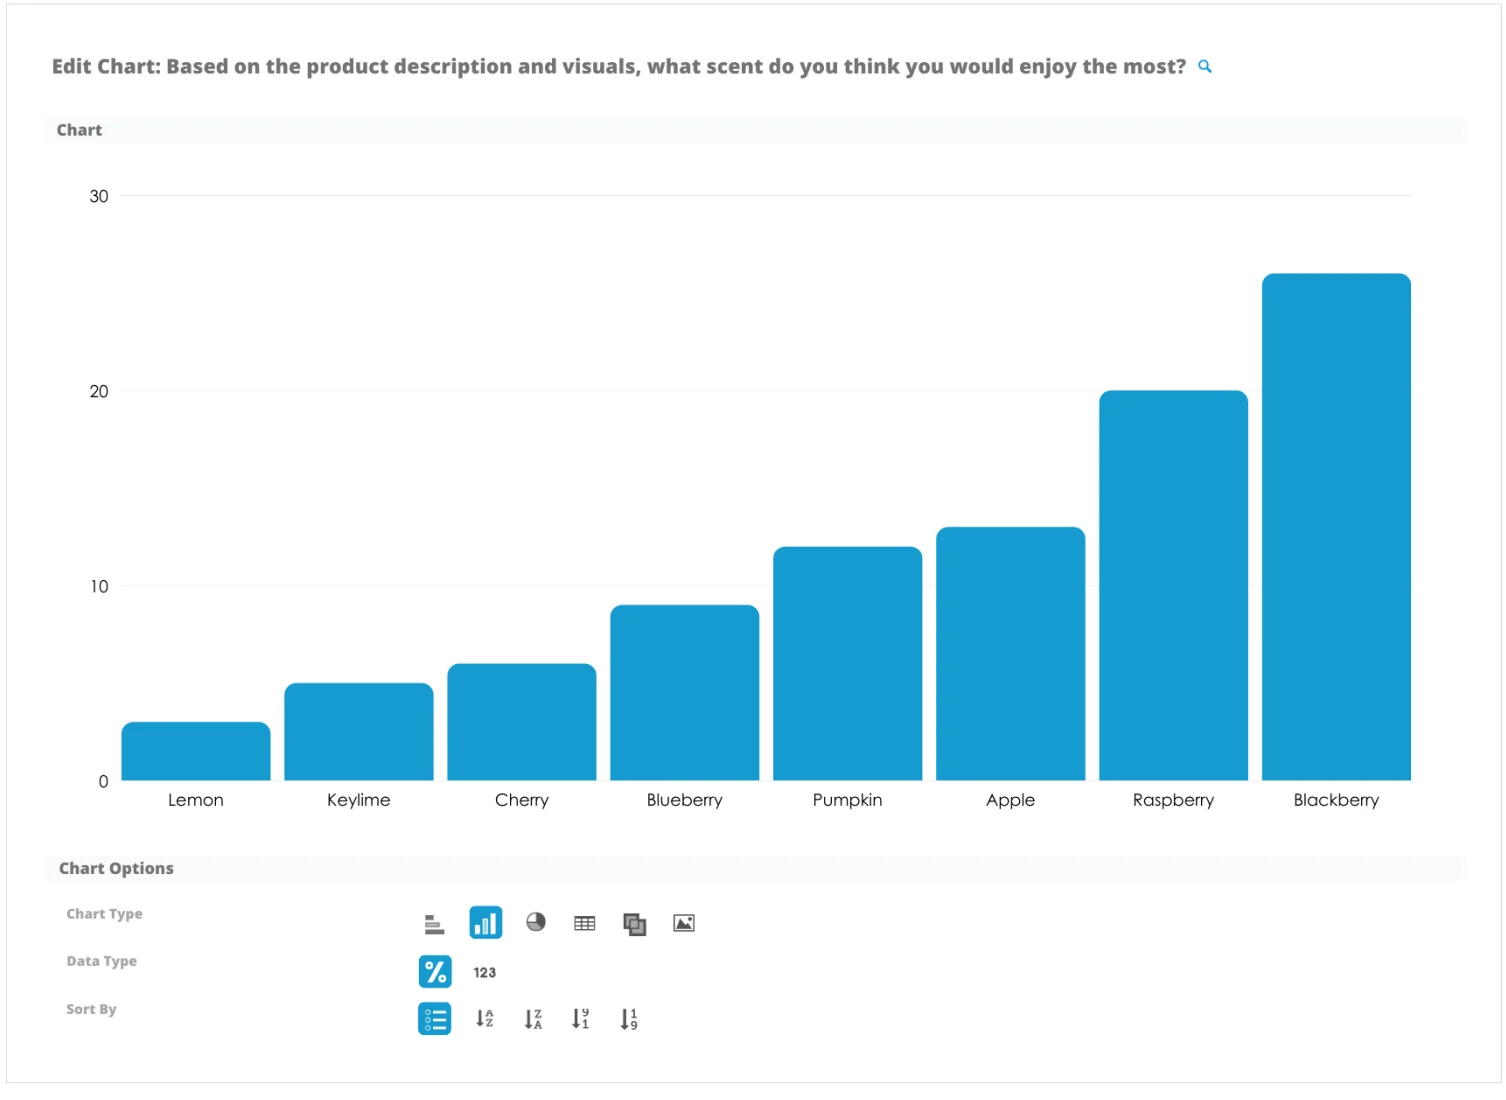
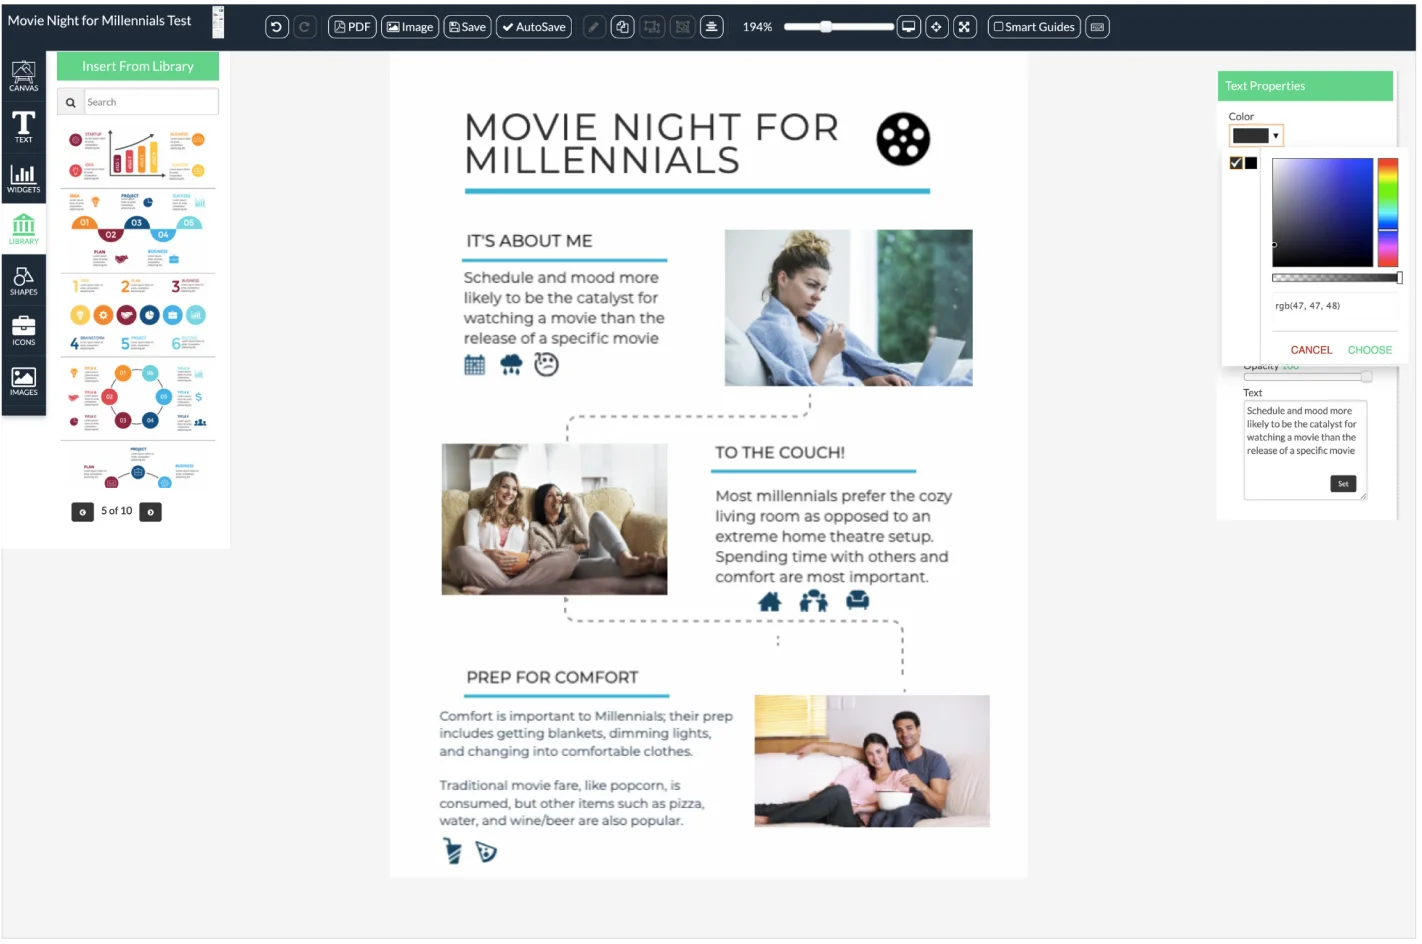
Built-in Chart Editor

The My-Take chart editor is powerful, simple, and flexible. Default charts automatically render to the researcher’s preference. However, there are 20+ options for chart type such as bar, pie, stack, crosstabs, table, image upload, and more. Additionally, there are options for count or percent, sorting, anchoring, and filtering.

Word Clouds

Word clouds are integrated into the My-Take reporting engine. These offer two primary uses. First, they offer a means to get a quick feel for the big picture results of open-ended questions. Second, they can be used as visuals for the final report. My-Take word clouds offer lots of customization options including font, color, and the ability to easily eliminate superfluous words.

word cloud visualizations

Word Clouds

Word clouds are integrated into the My-Take reporting engine. These offer two primary uses. First, they offer a means to get a quick feel for the big picture results of open-ended questions. Second, they can be used as visuals for the final report. My-Take word clouds offer lots of customization options including font, color, and the ability to easily eliminate superfluous words.

crosstabs banner tables and statistics

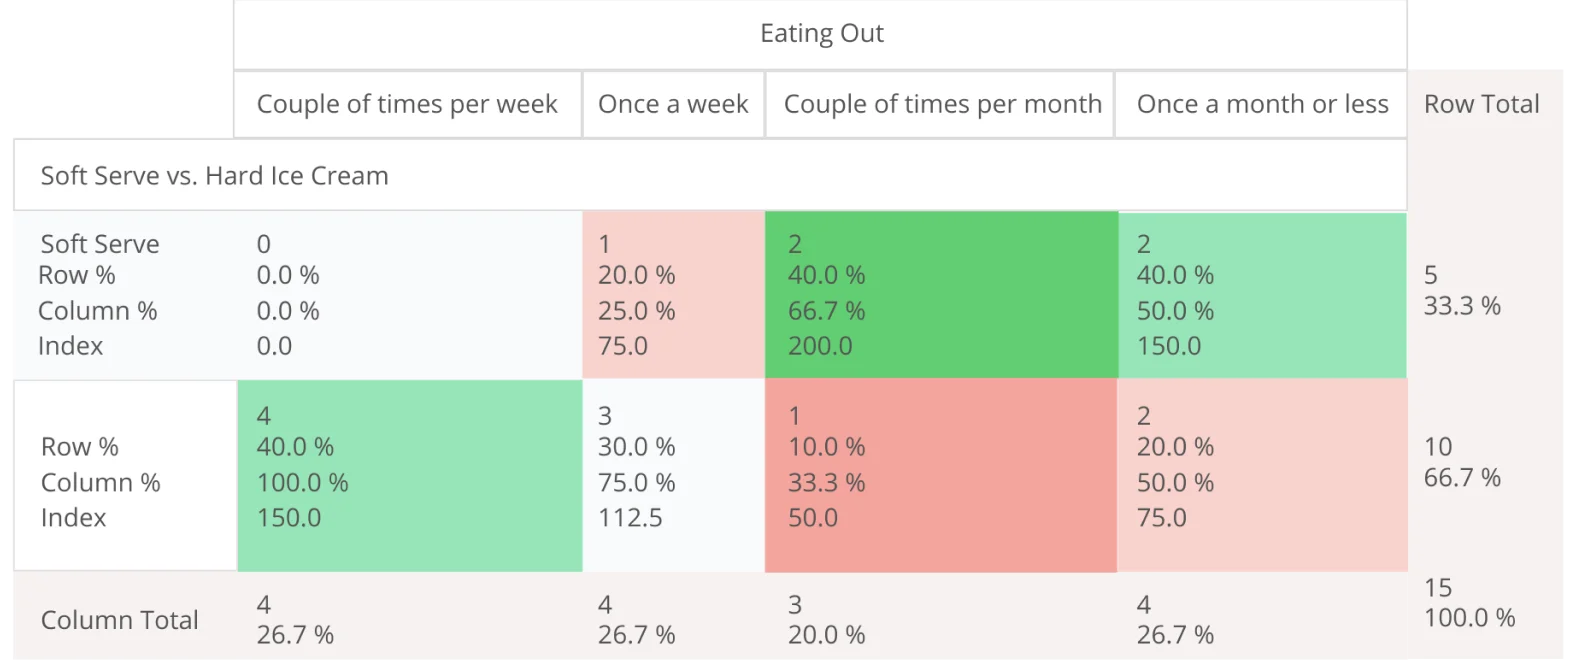
Crosstabs, Banners, and Statistics

The My-Take platform features cross tabs and core statistics.

Cross tabs allow for more detailed analysis and are completely integrated into the platform. There is also an option for formatted banner tables allowing you to nest any number of additional questions or demographics.

Statistics options include significance testing and correlation. The significance testing can be toggled to 90, 95, and 99 percent confidence level.

Infographic Builder

Infographics allow for high impact graphic representation of the data for individual or a series of reports. Templates and widgets provide the ability to easily create annual report level graphics. Clients typically use this feature for communicating select results throughout their organization, or as a means to share back select data with community members.

infographic creator
infographic creator

Infographic Builder

Infographics allow for high impact graphic representation of the data for individual or a series of reports. Templates and widgets provide the ability to easily create annual report level graphics. Clients typically use this feature for communicating select results throughout their organization, or as a means to share back select data with community members.

insight community metrics and alerts

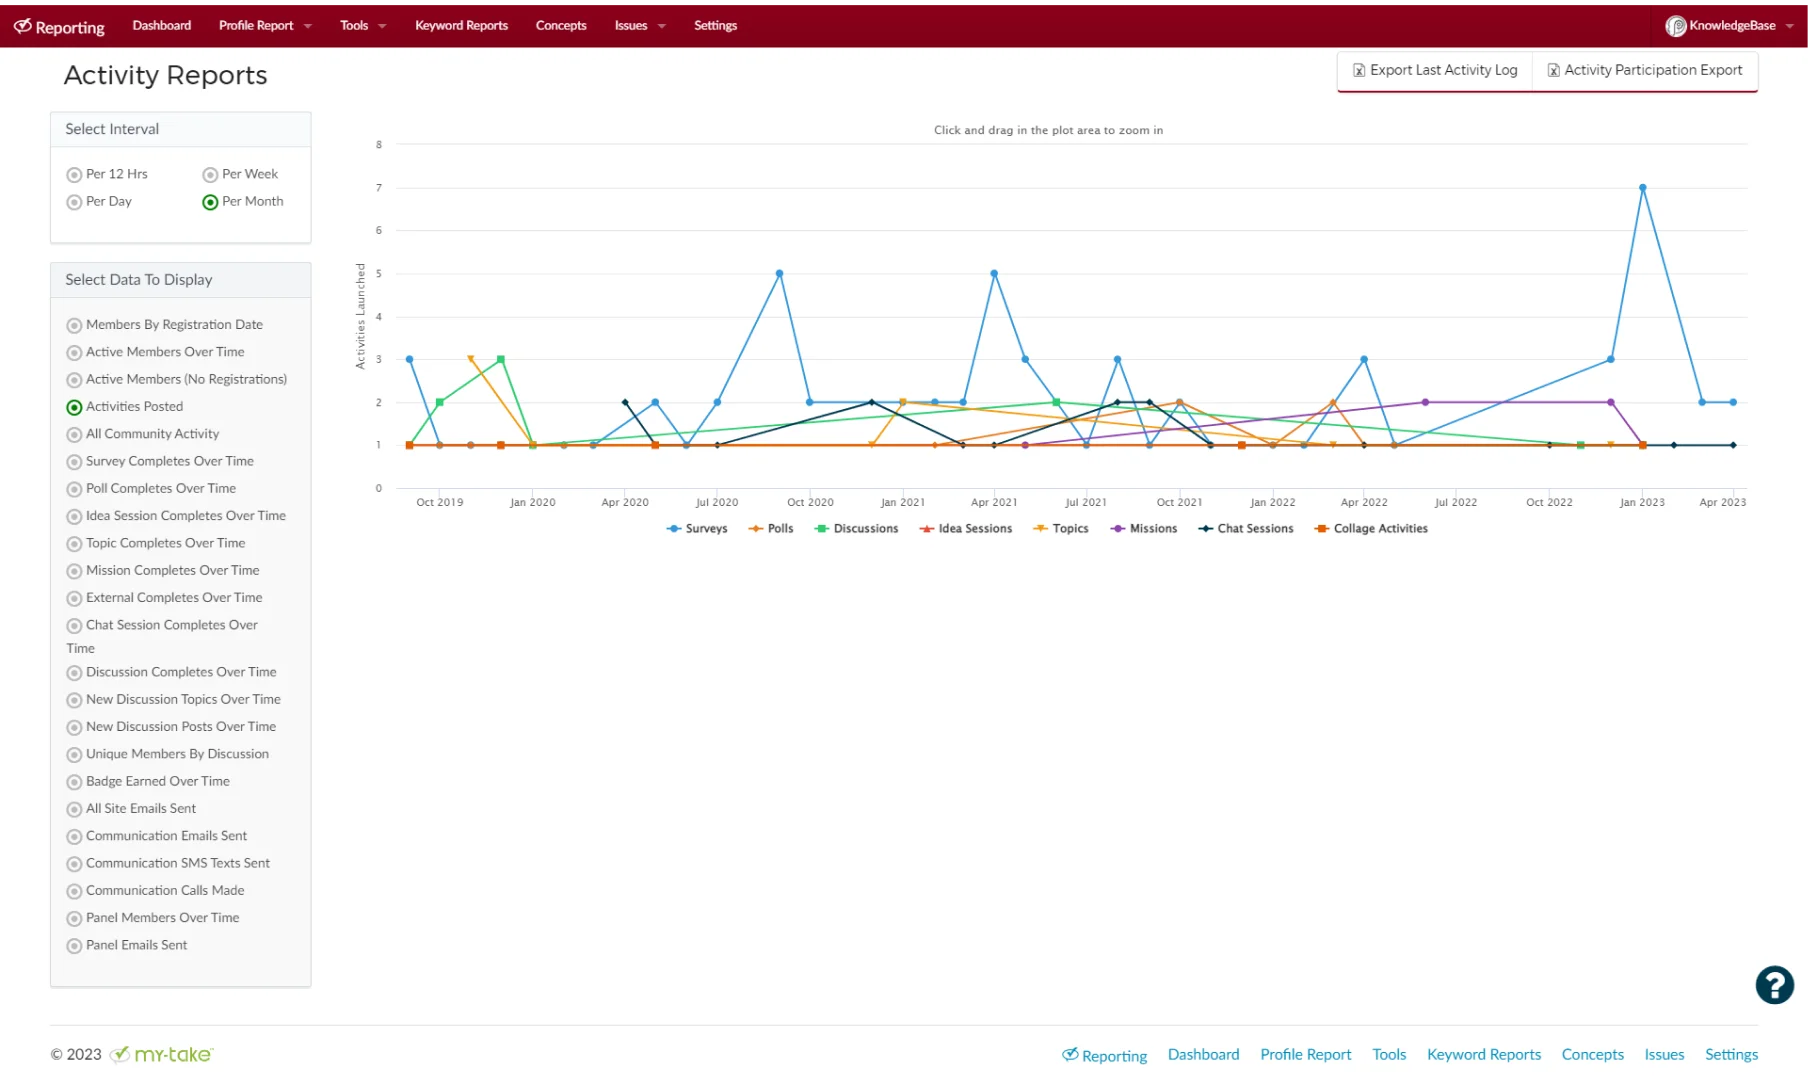
Advanced Alerts & Metrics

Keyword Alerts - Get real time alerts when community members mention keywords of interest, and monitor them over time.

Community Health - Monitor key metrics and member participation with our real time activity reports.

Video Editor

Integrated video editor, allows you to create highlight reel montages of your members' multimedia uploads.

integrated video editor

Video Editor

Integrated video editor, allows you to create highlight reel montages of your members' multimedia uploads.

demographic reporting data

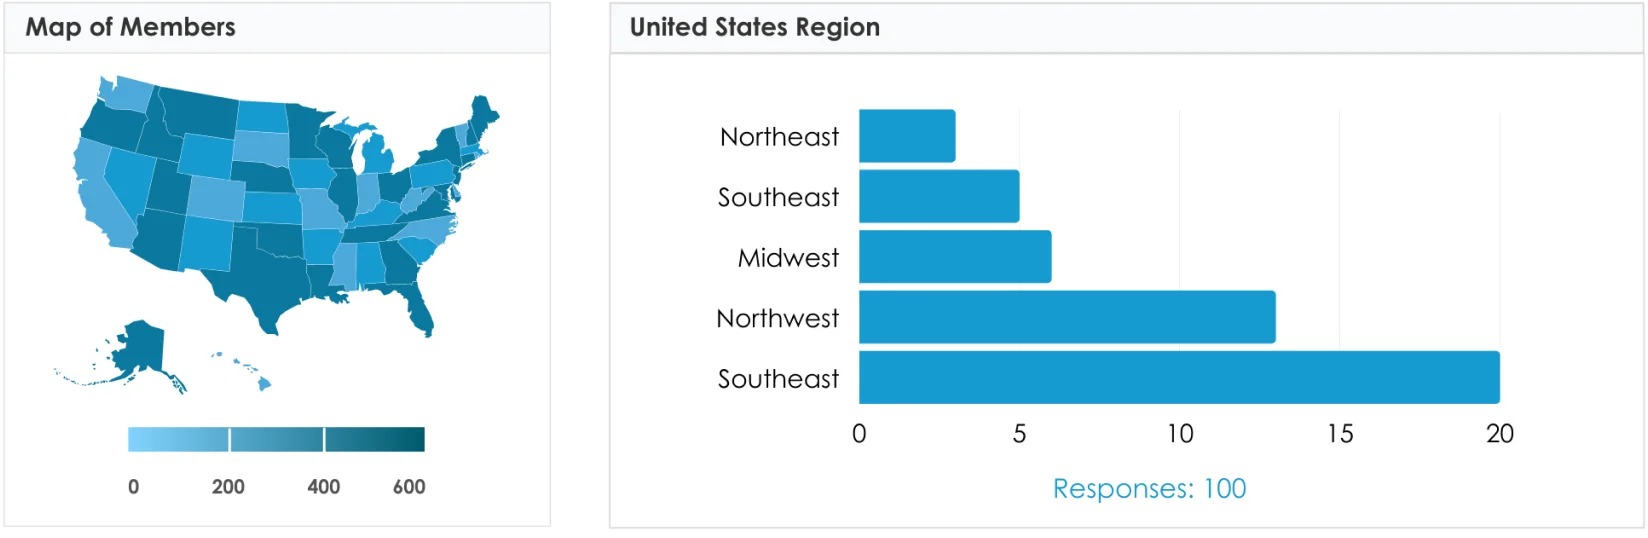
Demographic Reporting

Community member demographics are integrated in to the reporting engine.

Quickly filter, segment, or include any available demographics available for community members.

Try the leading edge platform.

Demo Platform